Friday, October 22, 2021

Lupine Publishers| Monitoring Time-Progression of Structural, Magnetic Properties of Ni Nano Ferrite During Synthesis

 Lupine Publishers| Modern Approaches On Material Science


Abstract

We present time-progression of structural, magnetic properties of NiFe2O4 nano ferrite during its synthesis via sol-gel auto combustion technique, monitored by x-ray diffraction XRD, and magnetic measurements. XRD patterns of the samples collected between 18-52 minutes shows the formation of the nano spinel phase (grain diameter: 15.4 nm-28.6 nm), presence of a-Fe2O3phase was also detected. Samples collected between 8-14 minutes show the amorphous nature of the samples. Time-progression studies show: a) sample taken after 20 minutes shows a sharp decrease of specific surface area (range between 39.01 m2/g to 72.73 m2/g), b) non-equilibrium cationic distribution for samples taken between 16-20 minutes with a continuous increase of Fe3+ ions population on B-site with simultaneous decrease of Ni2+ population, c) for samples taken after 22, 52 minutes, cationic distribution is close to its ideal value of (Fe3+) [Ni2+Fe3+], d) alteration of a degree of inversion (d), oxygen parameter (u), modification of A-O-B, A-O-A, B-O-B super-exchange interactions, e) ferrimagnetically aligned core, and spin disorder on the surface with a thickness between 1.9 nm to 3.6 nm, reducing the saturation magnetization (ranging between 11.7 - 25.5 Am2/kg), as compared to bulk Ni ferrite (55 Am2/kg), f) low squareness ratio values (0.15-0.22) shows the presence of multi-domain nanoparticles, with coercivity between 111-157 Oe.

Keywords: Time-evolution of properties; Sol-gel auto combustion synthesis; XRD; Nano Ni ferrite; Cationic distribution; Magnetic properties

Introduction

Spinel ferrites with general formula Me2+O.Fe3+2 O3, [Me: Divalent metal ion e.g. – Ni2+, Zn2+, Mg2+ Co2+ etc.], display face-centered cubic (fcc) structure, with two inter-penetrating sub-lattices: tetrahedrally coordinated (A site), octahedrally coordinated (B site) [1]. Nickel ferrite (NiFe2O4) has inverse spinel structure expressed as: (Fe3+) [Ni2+Fe3+] [1]. Allocation of cations on A, B site is crucial in determining properties of spinel ferrites [2,3], can be effectively used to achieve desired properties. Literature gives Ni ferrite synthesis using various methods including mechanical milling [4], coprecipitation [5], hydrothermal synthesis [6], sol-gel auto combustion method [7], showing the effect of the technique on structural, magnetic properties. Literature also reports real-time monitoring (in-situ studies) of properties [8,9], require special, sophisticated equipment, may not be available in all laboratories. Ex-situ monitoring of properties [10], describing the time-evolution of structural, magnetic properties, is a rather simple, more convenient way to perform experiments by utilizing standard laboratory equipment available in many laboratories. Ni ferrite is used in magnetic resonance imaging (MRI) agents [5], photocatalysis for water purification, antimicrobial activity [11], etc.) hence tuning its properties are preferred for improved efficiency.So, in this work, we present the time-development of structural, magnetic properties of NiFe2O4 nano ferrite during its synthesis via sol-gel auto combustion technique. Prepared samples are investigated via x-ray diffraction 'XRD,' vibration sample magnetometry, to get complimentary information on structural, magnetic properties.

Experimental Details

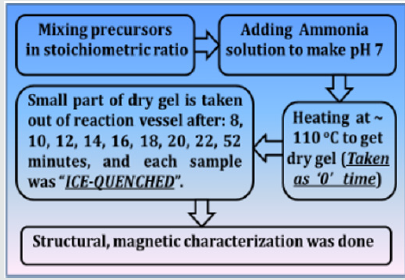
NiFe2O4 ferrite samples were synthesized by the sol-gel auto-combustion protocol, as described in detail in [12], by utilizing AR grade -nitrate/acetate-citrate precursors: Nickel acetate - Ni(CH₃CO₂)₂·4H₂O, Ferric nitrate (Fe(NO3)3.9H2O), Citric acid - C6H8O7]. The precursors were mixed in the stoichiometric ratio, were dissolved in 10 ml de-ionized water by keeping metal salts to fuel (citric acid) ratio as 1:1. At the same time, the solution pH was maintained at 7. Now the solution was heated at ~110 ̊C. As dry gel starts to form (taken as 0 minutes) small part of the sample is taken out from the reaction vessel (in an interval of 8, 10, 12, 14, 16, 18, 22, and 52 minutes), and were immediately ice-quenched to room temperature. Powder samples were used for Cu-K- X-ray diffraction 'XRD' measurements (Bruker D8 diffractometer), hysteresis loops by vibrating sample magnetometer. Full-profile XRD analysis was done by MAUD Rietveld refinement software [13] to obtain the lattice parameter (apex.). XRD analysis gives Scherrer's crystalline size D (calculated by the integral width of 311 peak, corrected for instrumental broadening), specific surface area (S), inversion parameter (d), oxygen parameter (u). XRD data was also analysed to get cationic distribution via Bertaut method [14], This provides cationic distribution by comparing experimental and computed intensity ratio of planes I(220)/I(400) and I(400)/I(422), susceptible to cationic distribution [12]. Cationic distribution was used to calculate theoretical or Néel magnetic moment at 0K (Ms(th)), theoretical lattice parameter (ath.), bond angles (θ1, θ2, θ3, θ4, θ5) as shown in [3]. Coercivity (Hc), saturation magnetization (Ms), remanence (Mr), squareness ratio (Mr/Ms) was obtained from hysteresis loops. (Figure 1) gives the schematic of sample synthesis and characterization.

Figure 1: Schematic of sample synthesis and characterization.
Lupinepublishers-openaccess-material-science-journal

Results and Discussion

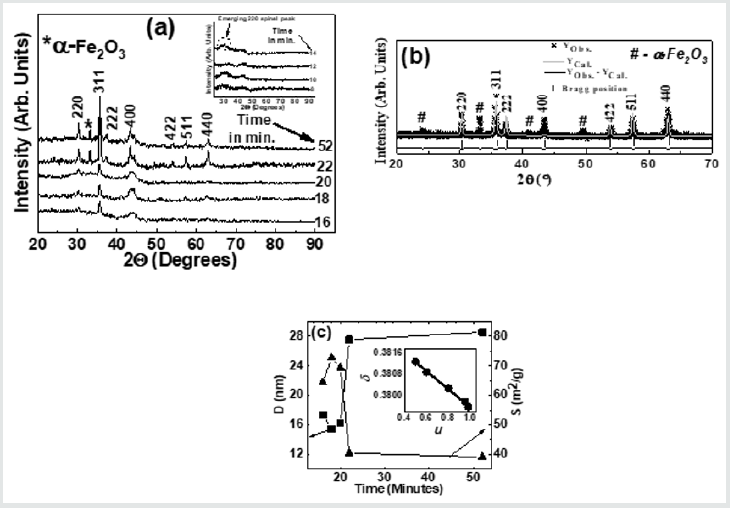
(Figure 2) (a) gives XRD-patterns of the studied NiFe2O4 samples collected after 18, 20, 22, and 52 minutes, confirm the formation of the spinel phase. XRD patterns also show the presence of a-Fe2O3 phase, ascribable to sample synthesis at a reasonably lower temperature (~110̊C), as reported in [15], while its disappearance is seen after higher sintering temperature. Figure 1(a) inset shows XRD patterns of samples collected after 8, 10, 12, 14 minutes show the amorphous nature of the samples. Only in the sample collected after 14 minutes, there is the start of spinel phase formation (indicated by a dotted circle). Illustrative Rietveld refined XRD pattern (Figure 2) b) of NiFe2O4 sample taken after 20 minutes also validates the cubic spinel ferrite phase formation. (Figure 2)(c) shows a variation of D (range between 15.4 nm to 28.6 nm) and S (range between 39.01 m2/g to 72.73 m2/g) for NiFe2O4 samples taken after 16, 18, 20 22, 52 minutes. A perusal of (Figure 2) (c) shows a well-known inverse relationship shown by the expression: [S = [6/(D ´rXRD)], where rXRDis x-ray density, as was also reported in[2]. (Figure 2) (c) shows that for samples taken after 22, 52 minutes, D sharply increases with concurrent reduction of S, is ascribable to significant changes in cationic distribution via migration of Ni2+ions to B site with simultaneous migration of Fe3+ ions on A site(as can be seen in Table 1). (Figure 2 )(c) inset display linear relation between d and u as was also observed earlier [3], shows that reduction of the degree of inversion (d) leads to a reduction of oxygen parameter (u), a measure of disorder in the studied system, is expected to affect the properties of the studied samples. Table 1 depicts the variation of experimental and theoretical lattice parameter (aexp., ath. ), inversion parameter (d), oxygen parameter (u), Cation distribution (for A, B site), and calculated, observed intensity ratios for I400/422, I220/400 plane for the studied samples. The observed variation of aexp. is consistent with changes in cationic distribution, and variation of the degree of inversion (d). Close agreement between observed, calculated aexp., ath. suggests that the computed cationic distribution agrees well with real distribution [16]. Close matching of calculated, observed intensity ratios for I400/422, I220/400 signifies an accurate cationic distribution among A, B site [17]. Cationic distribution illustrates that as we go from NiFe2O4 samples taken after 16, 18, and 20 minutes, the population of Fe3+ ions on B site increases from 1.2 to 1.5 with a concurrent decrease of Ni2+ ions from 0.80 to 0.50. For samples taken after 22, 52 minutes Fe3+ population on B site decreases, while Ni2+ ion population increases up to 0.98, which is close to the ideal inverse cationic distribution of (Fe3+) [Ni2+Fe3+] [1].

Figure 2: (a): XRD patterns of the studied NiFe2O4 samples taken after 16, 18, 20 22, 52 minutes showing the formation of the spinel phase. Inset: XRD patterns of the studied samples taken after 8, 10, 12, 14 minutes. (b): Illustrative Rietveld refined XRD pattern of NiFe2O4 sample taken after 20 minutes (* - Experimental data, Solid line - theoretically analyzed data, |- Bragg peak positions, Bottom line- Difference between experimental, and fitted data). (c) variation of grain diameter (D) and specific surface area (S) for NiFe2O4samples taken after 16, 18, 20 22, 52 minutes. Line connecting points guide to the eye. Inset: variation of inversion parameter (d) with oxygen parameter (u). The straight line is a linear fit to the experimental data.
Lupinepublishers-openaccess-material-science-journal

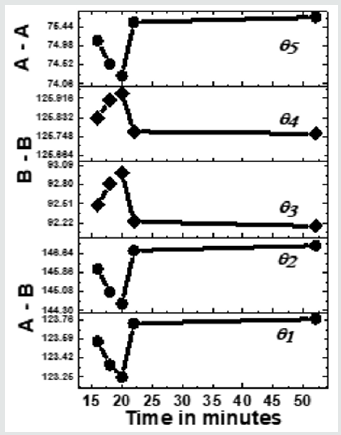
Figure 3 depicts the variation of bond angles between cations, cation-anion q1, q2,q3, q4and q5, for the studied samples taken between 16 - 52 minutes. In samples taken after 8, 10, 12, and 14 minutes, due to the absence of the spinel phase, bond angles could not be computed. Bond angles provide information on super-exchange interaction (A-O-B, A-O-A, B-O-B), mediate by oxygen. (Figure 3) shows that for samples taken after 16, 16, 20 minutes q1, q2, q5, decreases while q3, q4increases, indicates a weakening of A–O–B, A– O–A and strengthening B–O–B super-exchange interaction as is also observed earlier [16]. For samples taken after 22, 52 minutes q1, q2, q5, increases, and q3, q4decreases reveals strengthening of A-O-B, A-O-A, and weakening of B-O-B super-exchange interaction, reported in the literature with compositional changes [3]. Samples taken after different times, there is a modification of A-O-B, A-O-A, B-O-B super-exchange interactions, are attributed to changes in dand u as shown in(Table 1), observed with compositional changes [3,16]. Observed A-O-B, A-O-A, B-O-B super-exchange interactions should mirror in magnetic properties, matches well with reported literature [3,16]. Thus, collecting samples after different times during synthesis is analogous to compositional changes in spinel ferrites, affects structural, magnetic properties [3, 12, 16, 18].

Figure 3: Dependence of bond angles (q1A-O-B,q2A-O-B, q3B-O-B,q4B-O-B, q5A-O-A) for NiFe2O4 samples taken after 16, 18, 20 22, 52 minutes. Line connecting points guide to the eye.
Lupinepublishers-openaccess-material-science-journal

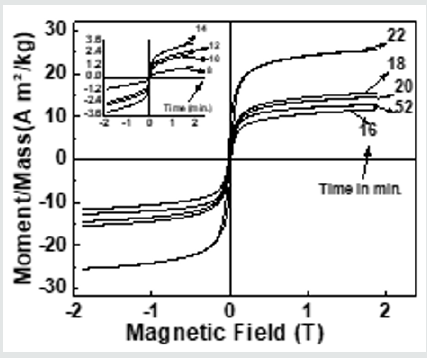
Figure 4 depicts hysteresis loops, reveal changes in Ms(exp.)samples taken after 16, 18, 20 22, 52 minutes, attributable to alteration of B-O-B, A-O-B, and A-O-A interaction, depends on bond angles, as shown in (Figure 3), and cationic distribution, as shown in (Table 1). (Figure 4) inset displays hysteresis loops of the samples taken after 8, 10, 12, 14 minutes, showing very low magnetization, attributable to the fact that in these samples ferrite phase is not formed, as was also observed in XRD data shown inset of (Figure 2) (a). Observed lower values of Ms(exp.) (ranging between 11.7 - 25.5 Am2/kg) as compared to the multi-domain bulk Ni ferrite (55 Am2/kg) is attributed to the two-component nanoparticle system as described in [19]consisting of a spin-disorder on the surface layer and ferrimagnetically aligned spins within the core. Computed magnetic dead layer thickness as described in [20,21]for NiFe2O4 samples taken after 16, 18, 20 22, 52 minutes are respectively 2.3, 1.8, 1.9, 2.5 and 3.6 nm. They confirm the contribution of 'dead layer thickness' in the reduction of Ms(exp.), apart from B-O-B, A-O-B, and A-O-A super-exchange interaction and cationic distribution.

Figure 4: Hysteresis loops of the studied NiFe2O4 samples taken after 16, 18, 20 22, 52 minutes. Inset: Hysteresis loops of the samples taken after 8, 10, 12, 14 minutes.
Lupinepublishers-openaccess-material-science-journal

Table 1: Variation of experimental and theoretical lattice parameter (aexp., ath.), inversion parameter (), oxygen parameter (u), Cation distribution (for A, B site), and observed, calculated intensity ratios for I400/422, I220/400 plane for the studied samples.


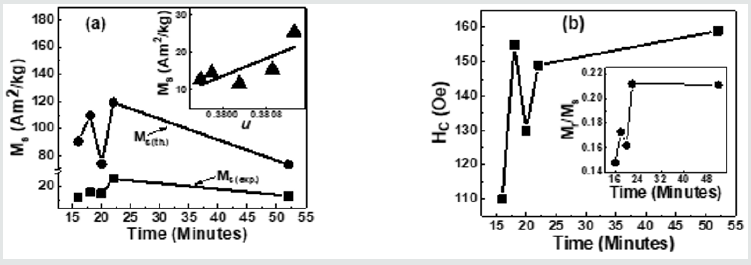
Figure 5(a) depicts Variation of Ms(exp.), Ms(th.)for NiFe2O4 samples taken after 16, 18, 20 22, 52 minutes. A perusal of figure 5(a) shows that observed behaviour is attributable to alteration of B-O-B, A-O-B, and A-O-A super-exchange interaction, depends on bond angles (see figure 3), and cationic distribution (see Table 1). Non-similar trend of Ms(exp.), Ms(th.)in (Figure 5)(a), shows that the magnetization behaviour is governed by Yafet-Kittel three sub-lattice model, described in [22], confirmed by the computed canting angle (aY-K) values for NiFe2O4 samples taken after 16, 18, 20 22, 52 minutes, which are respectively 52.7, 56.6, 46.2, 55.7, 46.9 ̊. The canting angle provides information on spin canting on the surface, is so-called 'magnetic dead layer,' leads to a reduction of Ms(exp.), which is lower than bulk saturation magnetization of Ni ferrite (55 Am2/kg). Inset of Figure 5 (a) shows the variation of Ms(exp.) with oxygen parameter 'u'(which is a measure of disorder in the samples [1]). Figure 5 (a) shows the disorder-induced enhancement of Ms(exp.),as was also reported in [3]. (Figure 5) (b) depicts the Coercivity(Hc) variation for NiFe2O4 samples taken after 16, 18, 20 22, 52 minutes. Obtained Hcand related Dvalues imply that studied samples lie in the region with overlap between single or multi-domain structures, as reported earlier [3]. (Figure 5) (b) Inset depicts the variation of Mr/Ms for NiFe2O4 samples taken after 16, 18, 20 22, 52 minutes. Mr/Ms values ranging between 0.15-0.22 reveal enhanced inter-grain interactions suggesting isotropic behavior of the material [23] reveal multi-domain particles with no preferential magnetization direction. Time-dependent tunable structural, magnetic properties during synthesis are valuable in achieving optimal properties of Ni ferrite for their usage in magnetic resonance imaging [5], hyperthermia [24] for cancer treatment, photocatalysis for water purification [11].

Figure 5: (a) Variation of Ms(exp.), Ms(th.)for NiFe2O4 samples taken after 16, 18, 20 22, 52 minutes. Inset: Dependence of Ms(exp.)on oxygen parameter (u), line connecting points in Inset are linear fit to the experimental data.; (b) Coercivity(Hc) variation for NiFe2O4 samples taken after 16, 18, 20 22, 52 minutes. Inset: Variation of Mr/Msfor NiFe2O4 samples taken after 16, 18, 20 22, 52 minutes.
Lupinepublishers-openaccess-material-science-journal

Summary

To summarize, the sol-gel auto combustion technique is used to observe the time-development of structural, magnetic properties of Ni ferrite. Changes in cationic distribution lead to modification of structural properties, magnetic interactions, responsible for observed magnetic properties. Time-progression of properties are of use to alter structural, magnetic properties of Ni ferrite as a material for its prospective usage in heterogeneous catalysis, water purifications, biomedical applications.

Acknowledgments

Authors thank Dr. M. Gupta-L. Behra, UGC-DAE CSR, Indore for XRD measurements. Work supported by UGC-DAE CSR, Indore project (No.: CSR-IC-ISUM-25/CRS-308/2019-20/1360, dated March 5, 2020).

Conflicts of Interest

Author

Author Contributions

Conception: SNK; Sample synthesis, RV, SNK; Measurements, analysis of data: SNK, RV; Supervision, Resources, supervision, project management: SNK; Writing the manuscript: SNK, RV. All authors approve the draft and participate in reviewing.

For more Lupine Publishers Open Access Journals Please visit our website:

 wt u have given that link add For more Modern Approaches on Material Science articles Please Click Here:

https://lupinepublishers.com/material-science-journal/


Friday, October 1, 2021

Lupine Publishers| Strength Improvement and Interface Characteristic of Dissimilar Metal Joints for TC4 Ti Alloy to Nitinol NiTi alloy

 Lupine Publishers| Modern Approaches On Material Science


Abstract

Laser welding of TC4 Ti alloy to NiTi alloy has been applied using pure Cu as an interlayer. Mechanical properties of the joints were evaluated by tensile tests. Based on avoiding the formation of Ti-Ni intermetallics in the joint, three welding processes for Ti alloy-NiTi alloy joint were introduced. The joint was formed while the laser was acted on the Cu interlayer. Experimental results showed that Cu interlayer was helping to decrease the Ti-Ni intermetallics by forming Ti-Cu phases in the weld. The average tensile strength of the joint was 216 MPa.

Keywords: Ti alloy; NiTi alloy; Cu interlayer; Laser welding; Microstructure; Tensile strength

Introduction

TiNi alloy has shape memory and pseudo-elastic properties, excellent corrosion resistance and good biocompatibility, it provides promising solutions to solve the problems in various applications such as aerospace, atomic energy, microelectronics, and medical equipment [1,2]. As we all know, the successful application of any advanced material depends not only on its original properties, but also on its development [3]. People are more and more interested in the combination of TiNi alloy and other materials, especially for the development of devices with different mechanical properties and corrosion resistance. Ti alloy has excellent comprehensive properties, such as high specific strength, high specific modulus, hardness, corrosion resistance and high damage resistance [4,5]. It is widely used in aerospace, marine industry, biomedical engineering, and military industry. The composite materials of TiNi alloy and Ti alloy can not only meet the requirements of heat conduction, conductivity, and corrosion resistance, but also meet the requirements of high strength but light weight [6]. Therefore, it will be widely used in aerospace, instrumentation, electronics, chemical industry, and other fields. Compared with single material property, this material can use the performance and cost advantages of each material to select the best material for each structural component [7]. However, the weldability of dissimilar materials also limits the wide application of these alloys. This leads to the formation of brittle-like intermetallic compounds (IMCs) in the weld zone. For example, Ti2Ni, NiTi, Ni3Ti [8]. The formation of Ti-Ni IMCs in the weld makes the weld brittle, and the mismatch of the thermal expansion coefficient of the two materials, it will lead to the formation of transverse cracks in the weld and the deterioration of mechanical properties [9-11]. In fact, TiNi alloy-Ti alloy joint is one of the most direct and effective methods to increase the use of TiNi alloy, Ti alloy and other lightweight materials in the field of aerospace and engineering manufacturing and to use structural lightweight design to achieve structural optimization, energy saving, environmental protection and safety [12]. Therefore, the effective connection between TiNi alloy and Ti alloy becomes an urgent problem.

At present, the most commonly used method is to insert an intermediate layer to improve the microstructure of the joint, which can improve the mechanical stability between TiNi alloy and Ti alloy and lead to the formation of other phases except for Ti-Ni IMCs [13]. This is because the addition of intermediate layer can reduce the fusion ratio of TiNi alloy and Ti alloy in the joint. This effect reduces the content of Ti and Ni in the weld metal, thus reducing the probability of the formation of Ti-Ni IMCs in the weld metal [14,15]. Elements such as niobium, zirconium, molybdenum, tantalum, and vanadium are recommended interlayers for dissimilar welding of Ti-based alloys, since they do not react with titanium [16]. However, due to the high price and unavailability of these elements, Ag, Cu and Ni are usually used as the interlayer for the welding of these two materials, among which Cu is the most widely used interlayer in the field of dissimilar materials welding [17]. These elements will react with Ti and may form new IMCs, but in a case that the hardness of the new phases are less than that of the primary intermetallic phases formed between base metals elements (Ti-Ni IMCs in here), so it is reasonable to use these metals as the interlayer. Compared with TiNi alloy and Ti alloy, Cu has higher ductility and lower melting point, so it can reduce the influence of thermal stress mismatch caused by solidification of welding pool during welding [18]. In addition, copper is much cheaper than Zr, Ta, Mo, Ni, V and other elements, and is easy to obtain. On the other hand, according to the research of Bricknell et al. [19] on ternary shape memory alloys of Ti-Cu-Ni, nickel atoms can be substituted with copper atoms in lattice structure of NiTi. This substitution leads to the formation of Ti (Ni, Cu) ternary shape alloy at different transition temperatures. Therefore, Cu has a good compatibility with NiTi.

Experimental Procedure

Materials

The base materials used in this experiment were TC4 Ti alloy and TiNi alloy. There are large differences in thermal conductivity and linear expansion coefficient between the two base materials, which would lead to large temperature gradient and thermal stress in the joint during welding process. The base materials were machined into 50 mm×40 mm×1 mm plate, and then cleaned with acetone before welding. 0.3 mm thick Cu sheet (99.99 at. %) were adopted as interlayer and placed on the contact surface of the base material fixed in fixture.

Welding Method

CW laser was used with average power of 1.20 kW, wavelength of 1080 nm and beam spot diameter of 0.1 mm. Schematic diagram of the welding process is shown in (Figure 1). Schematic diagram of the welding process is shown in (Figure 1), where a good fitup between the TC4-Cu-NiTi was required to prevent gaps and ensure adequate heat transfer to form a joint. Laser welding for joint. During welding, laser beams were focused on the centrelines of the Cu interlayer (Figure 1). According to the thickness of the Cu interlayer to adjust welding parameters. At the same time can adjust parameters to change the fusion ratio of the base material. Laser offset for weld of joint was defined as 0 mm. The welding process parameters were: laser beam power of 396W, defocusing distance of +5 mm, welding speed of 650mm/min. Argon gas with the purity of 99.99% was applied as a shielding gas with total flow of 20L/min at top of the joint. Supplementary gas protection device covering the melted zone has been used to minimize the risk of oxidation.

Figure 1: Sketch of hydro-power plant.


Characterization Methods

The cross sections of joints were polished and etched in the reagent with 2ml concentrated HNO3 and 6 ml concentrated HF. The microstructure of joints was studied by optical microscopy (Scope Axio ZEISS), scanning electron microscope SEM (S-3400) with fast energy dispersion spectrum EDS analyzer, and selected area XRD (X’Pert3 Powder) analysis. Vickers microhardness tests for the weld carried out with a 10s load time and a 200g load. Tensile strength of the joints was measured by using universal testing machine (MTS Insight 10 kN) with cross head speed of 2mm/min.

Results and Discussion

Characterization of Joint

According to the previous research results, the microstructure, and mechanical properties of NiTi alloy/Ti alloy joint can be improved by adding appropriate interlayer materials, but the formation of brittle and hard Ti-Ni intermetallic compounds in the weld cannot be avoided. To further improve the mechanical properties of NiTi alloy/Ti alloy joint, the design idea of laser welding of NiTi alloy and Ti alloy assisted by metal transition layer is proposed in this paper. The purpose is to avoid the metallurgical reaction between Ti and Ni and improve the microstructure and mechanical properties of NiTi alloy/Ti alloy joint.

Macro-Characteristics

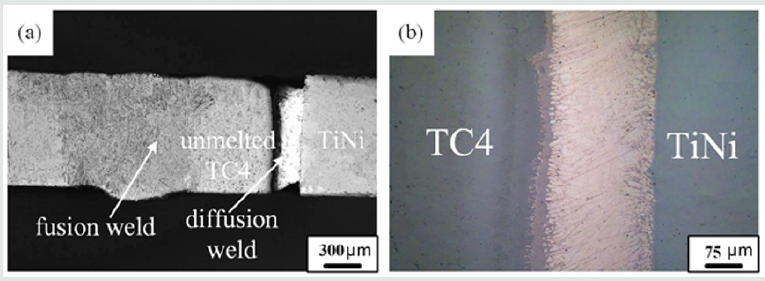
The optical microscopy image of the cross section of the joint is shown in (Figure 2a). The joint can fall into three parts: the fusion weld formed at the Ti alloy side, unmelted Ti alloy and the diffusion weld formed at the TiNi-Ti alloy interface. The fusion weld did not form Ti-Fe intermetallics due to the presence of unmelted Ti alloy. The average width of fusion weld, unmelted Ti alloy and diffusion weld was 1.8 mm, 0.35 mm and 0.17 mm, respectively. Because the microstructure of the fusion weld is quite different from that of the diffusion weld, the diffusion weld becomes black after corrosion. (Figure 2b) presents the optical image before corrosion of the diffusion weld. It does not present such defects as pores and macro-cracks. The unmelted part of Ti alloy acted as a heat sink absorbing a significant amount of energy from the welding pool and transferring it to the TiNi alloy side [20]. Hence, the filler metal of TiNi-Ti alloy interface had a high temperature during welding although it was not subjected to laser radiation. The temperature was high enough to promote atomic interdiffusion. This meets the temperature requirement for diffusion welding. Moreover, the local heating of the Ti alloy side caused uneven volume expansion and thermal stress was produced, which helped to obtain an intimate contact between the TiNi alloy, Cu-based fillers and Ti alloy surface. The high temperature and the intimate contact at the TiNi-Ti alloy interface provided favourable conditions for atomic (Cu, Zn, Ti, Ni) interdiffusion. Therefore, a diffusion weld was formed originated from atomic (Cu, Zn, Ti, Ni) interdiffusion at the Ti alloy-filler metal and filler metal-TiNi alloy interface. Additionally, the unmelted Ti alloy was beneficial to relieve and accommodate the thermal stress in the joint, which could help to improve the mechanical properties of the joints.

Figure 2: Macroscopic feature of the joint: (a) optical image of the cross section of the joint; (b) optical image before corrosion of the Ti alloy-TiNi alloy interface.

Lupinepublishers-openaccess-material-science-journal

Microstructure Analysis

The optical image of the fusion weld is shown in (Figure 3a), and no defects were observed in it. SEM image of the fusion weld is shown in (Figure 3b). The fusion weld mainly consists of acicular structure. The optical image of the diffusion weld at NiTi-Ti alloy interface is shown in (Figure 3c). It can be observed that, the diffusion weld contained three zones marked as Ⅰ, Ⅱ and Ⅲ sorted by their morphologies and colours. (Figures 3d, 3e and 3f)correspond to the three zones in (Figure 3c), respectively. The compositions of each zone (denoted by letter A-C in (Figure 3)) were studied using SEM-EDS. EDS analysis was applied to these zones to measure the compositions of the reaction products and the results are listed in Table 1. Based on the previous analysis, the microstructure of the diffusion weld was mainly composed of Cu-based fillers. The chemical composition of zone Ⅰ was consistent with the Cu-based fillers. Based on the EDS analyses results and Cu-Zn phase diagram, the main microstructure of zone Ⅰ was defined as β-CuZn phase. When the laser beam was focused near the Ti alloy-filler metal interface, the element diffusion occurs immediately between the base materials and filler metal and causes its component to deviate from the original component. The interdiffusion of Cu, Zn, Ti and Ni elements occurred at diffusion welding interface (Ti alloy-filler metal and filler metal-NiTi alloy). At this moment, the dissolution of Ti and Ni into the filler metal occurred under the high concentration gradient, which formed solid-phase reaction layer, and this reaction layer exists only in the smaller region of the NiTi-Ti alloy interface. As shown in, zone Ⅱ and zone Ⅲ were reaction layers formed by element diffusion. Based on Ti-Cu-Ni phase diagram, the microstructure of zone Ⅱ was defined as TiCu2+NiZn. Based on Cu-Ti-Zn phase diagram, the microstructure of zone Ⅲ was defined as Ti3Cu4+Ti2Zn3. Therefore, the main microstructures of diffusion weld were TiCu2+NiZn, β-CuZn and Ti3Cu4+Ti2Zn3.

Table 1: The chemical composition of each phase in joint C (wt.%).

Lupinepublishers-openaccess-material-science-journal

Figure 3: Microstructures of the joint : (a) optical image of fusion zone; (b) SEM image of fusion zone; (c) optical image of the diffusion weld; (b) SEM image of the zone I in Fig. 3c; (c) SEM image of the zone II in Fig. 3c; (d) SEM image of the zone III in Fig. 3c.

Lupinepublishers-openaccess-material-science-journal

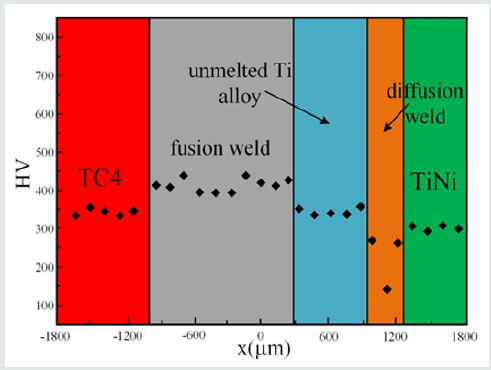
Figure 4: Vickers microhardness measurements at semi-height of joint (zero point situated in the center of joint).

Lupinepublishers-openaccess-material-science-journal

Tensile Tests and Fracture Analysis

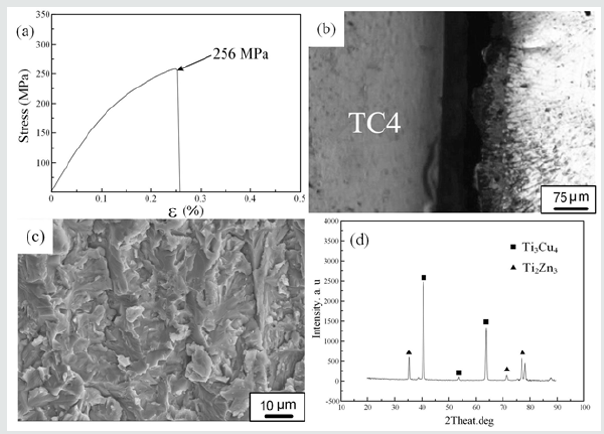
The maximum tensile strength of the joint was about 256 MPa (Figure 5a). The joint fractured in Ti alloy side of the diffusion weld during tensile tests (Figures 5b, 5c)shows fracture surface of the joint exhibiting typical brittle characteristics. Moreover, as shown in (Figure 5d), XRD analyses of fracture surface detected Ti3Cu4 and Ti2Zn3 phases. This confirmed the presence of Ti-Cu and Ti-Zn intermetallics at fracture surfaces. It should be noted that there was no Ti-Ni intermetallics in the brazed weld. Reaction layer at Ti alloy side in diffusion weld became the weak zone of the joint, which led to the failure in the tensile test.Based on the above results, the formation of Ti-Ni intermetallic compounds is avoided due to the presence of unmelted Ti alloy in the joint. Only a small amount of Ti-Cu intermetallic compounds is formed in the reaction layer at the NiTi-Ti alloy interface. Due to the rapid heating and cooling speed of laser welding, the holding time at high temperature is short, and it is easy to form a narrow reaction zone at the NiTi-Ti alloy interface. In addition, higher cooling rate inhibited the growth of dendrite structure in the reaction zone. Therefore, it is easy to obtain fine microstructure in the reaction zone, which is conducive to reducing the brittleness of the reaction layer. The results show that the formation of narrow reaction layer and fine metallurgical structure at the interface is one of the main reasons to improve the joint strength.

Figure 5: Tensile test results of joint: (a) Tensile test curve; (b) Fracture location; (c) SEM image of fracture surface; (d) XRD analysis results of fracture surface.

Lupinepublishers-openaccess-material-science-journal

Conclusion

The possibility of welding processes for connect TC4 Ti alloy to NiTi alloy with Cu-base filler metal was studied. The main conclusions are presented below. without filler metal, For joint with a laser beam offset of 1.2 mm for Ti alloy, the unmelted Ti alloy was selected as an barrier to avoid mixing of the NiTi alloy and Ti alloy which eliminated the formation of brittle Ti-Ni intermetallic in the joint . A diffusion weld was formed at the NiTi alloy-Ti alloy interface with the main microstructure of TiCu2+NiZn, β-CuZn and Ti3Cu4+Ti2Zn3. A great amount of atomic diffusion occurs at the NiTi-Ti alloy interface during welding, and the thickness of diffusion weld can reach hundreds of micrometres. The tensile resistance of the joint was determined by diffusion weld. The maximum tensile strength of joint was 256 MPa.

For more Lupine Publishers Open Access Journals Please visit our website:

 wt u have given that link add For more Modern Approaches on Material Science articles Please Click Here:

https://lupinepublishers.com/material-science-journal/


Happy Thanksgiving 2022!!!

                      Thanksgiving is a joyous invitation to shower the world with love and gratitude. Forever on Thanksgiving the heart wil...