Lupine Publishers| Modern Approaches On Material Science
Abstract
We present time-progression of structural, magnetic properties of NiFe2O4 nano ferrite during its synthesis via sol-gel auto combustion technique, monitored by x-ray diffraction XRD, and magnetic measurements. XRD patterns of the samples collected between 18-52 minutes shows the formation of the nano spinel phase (grain diameter: 15.4 nm-28.6 nm), presence of a-Fe2O3phase was also detected. Samples collected between 8-14 minutes show the amorphous nature of the samples. Time-progression studies show: a) sample taken after 20 minutes shows a sharp decrease of specific surface area (range between 39.01 m2/g to 72.73 m2/g), b) non-equilibrium cationic distribution for samples taken between 16-20 minutes with a continuous increase of Fe3+ ions population on B-site with simultaneous decrease of Ni2+ population, c) for samples taken after 22, 52 minutes, cationic distribution is close to its ideal value of (Fe3+) [Ni2+Fe3+], d) alteration of a degree of inversion (d), oxygen parameter (u), modification of A-O-B, A-O-A, B-O-B super-exchange interactions, e) ferrimagnetically aligned core, and spin disorder on the surface with a thickness between 1.9 nm to 3.6 nm, reducing the saturation magnetization (ranging between 11.7 - 25.5 Am2/kg), as compared to bulk Ni ferrite (55 Am2/kg), f) low squareness ratio values (0.15-0.22) shows the presence of multi-domain nanoparticles, with coercivity between 111-157 Oe.
Keywords: Time-evolution of properties; Sol-gel auto combustion synthesis; XRD; Nano Ni ferrite; Cationic distribution; Magnetic properties
Introduction
Spinel ferrites with general formula Me2+O.Fe3+2 O3, [Me: Divalent metal ion e.g. – Ni2+, Zn2+, Mg2+ Co2+ etc.], display face-centered cubic (fcc) structure, with two inter-penetrating sub-lattices: tetrahedrally coordinated (A site), octahedrally coordinated (B site) [1]. Nickel ferrite (NiFe2O4) has inverse spinel structure expressed as: (Fe3+) [Ni2+Fe3+] [1]. Allocation of cations on A, B site is crucial in determining properties of spinel ferrites [2,3], can be effectively used to achieve desired properties. Literature gives Ni ferrite synthesis using various methods including mechanical milling [4], coprecipitation [5], hydrothermal synthesis [6], sol-gel auto combustion method [7], showing the effect of the technique on structural, magnetic properties. Literature also reports real-time monitoring (in-situ studies) of properties [8,9], require special, sophisticated equipment, may not be available in all laboratories. Ex-situ monitoring of properties [10], describing the time-evolution of structural, magnetic properties, is a rather simple, more convenient way to perform experiments by utilizing standard laboratory equipment available in many laboratories. Ni ferrite is used in magnetic resonance imaging (MRI) agents [5], photocatalysis for water purification, antimicrobial activity [11], etc.) hence tuning its properties are preferred for improved efficiency.So, in this work, we present the time-development of structural, magnetic properties of NiFe2O4 nano ferrite during its synthesis via sol-gel auto combustion technique. Prepared samples are investigated via x-ray diffraction 'XRD,' vibration sample magnetometry, to get complimentary information on structural, magnetic properties.
Experimental Details
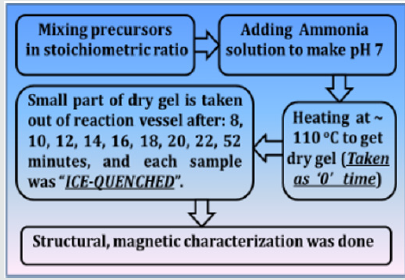
NiFe2O4 ferrite samples were synthesized by the sol-gel auto-combustion protocol, as described in detail in [12], by utilizing AR grade -nitrate/acetate-citrate precursors: Nickel acetate - Ni(CH₃CO₂)₂·4H₂O, Ferric nitrate (Fe(NO3)3.9H2O), Citric acid - C6H8O7]. The precursors were mixed in the stoichiometric ratio, were dissolved in 10 ml de-ionized water by keeping metal salts to fuel (citric acid) ratio as 1:1. At the same time, the solution pH was maintained at 7. Now the solution was heated at ~110 ̊C. As dry gel starts to form (taken as 0 minutes) small part of the sample is taken out from the reaction vessel (in an interval of 8, 10, 12, 14, 16, 18, 22, and 52 minutes), and were immediately ice-quenched to room temperature. Powder samples were used for Cu-K- X-ray diffraction 'XRD' measurements (Bruker D8 diffractometer), hysteresis loops by vibrating sample magnetometer. Full-profile XRD analysis was done by MAUD Rietveld refinement software [13] to obtain the lattice parameter (apex.). XRD analysis gives Scherrer's crystalline size D (calculated by the integral width of 311 peak, corrected for instrumental broadening), specific surface area (S), inversion parameter (d), oxygen parameter (u). XRD data was also analysed to get cationic distribution via Bertaut method [14], This provides cationic distribution by comparing experimental and computed intensity ratio of planes I(220)/I(400) and I(400)/I(422), susceptible to cationic distribution [12]. Cationic distribution was used to calculate theoretical or Néel magnetic moment at 0K (Ms(th)), theoretical lattice parameter (ath.), bond angles (θ1, θ2, θ3, θ4, θ5) as shown in [3]. Coercivity (Hc), saturation magnetization (Ms), remanence (Mr), squareness ratio (Mr/Ms) was obtained from hysteresis loops. (Figure 1) gives the schematic of sample synthesis and characterization.
Results and Discussion
(Figure 2) (a) gives XRD-patterns of the studied NiFe2O4 samples collected after 18, 20, 22, and 52 minutes, confirm the formation of the spinel phase. XRD patterns also show the presence of a-Fe2O3 phase, ascribable to sample synthesis at a reasonably lower temperature (~110̊C), as reported in [15], while its disappearance is seen after higher sintering temperature. Figure 1(a) inset shows XRD patterns of samples collected after 8, 10, 12, 14 minutes show the amorphous nature of the samples. Only in the sample collected after 14 minutes, there is the start of spinel phase formation (indicated by a dotted circle). Illustrative Rietveld refined XRD pattern (Figure 2) b) of NiFe2O4 sample taken after 20 minutes also validates the cubic spinel ferrite phase formation. (Figure 2)(c) shows a variation of D (range between 15.4 nm to 28.6 nm) and S (range between 39.01 m2/g to 72.73 m2/g) for NiFe2O4 samples taken after 16, 18, 20 22, 52 minutes. A perusal of (Figure 2) (c) shows a well-known inverse relationship shown by the expression: [S = [6/(D ´rXRD)], where rXRDis x-ray density, as was also reported in[2]. (Figure 2) (c) shows that for samples taken after 22, 52 minutes, D sharply increases with concurrent reduction of S, is ascribable to significant changes in cationic distribution via migration of Ni2+ions to B site with simultaneous migration of Fe3+ ions on A site(as can be seen in Table 1). (Figure 2 )(c) inset display linear relation between d and u as was also observed earlier [3], shows that reduction of the degree of inversion (d) leads to a reduction of oxygen parameter (u), a measure of disorder in the studied system, is expected to affect the properties of the studied samples. Table 1 depicts the variation of experimental and theoretical lattice parameter (aexp., ath. ), inversion parameter (d), oxygen parameter (u), Cation distribution (for A, B site), and calculated, observed intensity ratios for I400/422, I220/400 plane for the studied samples. The observed variation of aexp. is consistent with changes in cationic distribution, and variation of the degree of inversion (d). Close agreement between observed, calculated aexp., ath. suggests that the computed cationic distribution agrees well with real distribution [16]. Close matching of calculated, observed intensity ratios for I400/422, I220/400 signifies an accurate cationic distribution among A, B site [17]. Cationic distribution illustrates that as we go from NiFe2O4 samples taken after 16, 18, and 20 minutes, the population of Fe3+ ions on B site increases from 1.2 to 1.5 with a concurrent decrease of Ni2+ ions from 0.80 to 0.50. For samples taken after 22, 52 minutes Fe3+ population on B site decreases, while Ni2+ ion population increases up to 0.98, which is close to the ideal inverse cationic distribution of (Fe3+) [Ni2+Fe3+] [1].
Figure 2: (a): XRD patterns of the studied NiFe2O4 samples taken after 16, 18, 20 22, 52 minutes showing the formation of the spinel phase. Inset: XRD patterns of the studied samples taken after 8, 10, 12, 14 minutes. (b): Illustrative Rietveld refined XRD pattern of NiFe2O4 sample taken after 20 minutes (* - Experimental data, Solid line - theoretically analyzed data, |- Bragg peak positions, Bottom line- Difference between experimental, and fitted data). (c) variation of grain diameter (D) and specific surface area (S) for NiFe2O4samples taken after 16, 18, 20 22, 52 minutes. Line connecting points guide to the eye. Inset: variation of inversion parameter (d) with oxygen parameter (u). The straight line is a linear fit to the experimental data.
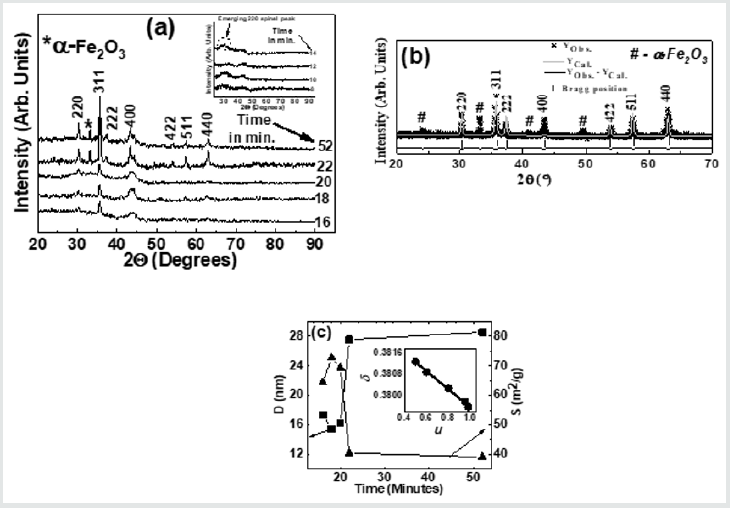
Figure 3 depicts the variation of bond angles between cations, cation-anion q1, q2,q3, q4and q5, for the studied samples taken between 16 - 52 minutes. In samples taken after 8, 10, 12, and 14 minutes, due to the absence of the spinel phase, bond angles could not be computed. Bond angles provide information on super-exchange interaction (A-O-B, A-O-A, B-O-B), mediate by oxygen. (Figure 3) shows that for samples taken after 16, 16, 20 minutes q1, q2, q5, decreases while q3, q4increases, indicates a weakening of A–O–B, A– O–A and strengthening B–O–B super-exchange interaction as is also observed earlier [16]. For samples taken after 22, 52 minutes q1, q2, q5, increases, and q3, q4decreases reveals strengthening of A-O-B, A-O-A, and weakening of B-O-B super-exchange interaction, reported in the literature with compositional changes [3]. Samples taken after different times, there is a modification of A-O-B, A-O-A, B-O-B super-exchange interactions, are attributed to changes in dand u as shown in(Table 1), observed with compositional changes [3,16]. Observed A-O-B, A-O-A, B-O-B super-exchange interactions should mirror in magnetic properties, matches well with reported literature [3,16]. Thus, collecting samples after different times during synthesis is analogous to compositional changes in spinel ferrites, affects structural, magnetic properties [3, 12, 16, 18].
Figure 3: Dependence of bond angles (q1A-O-B,q2A-O-B, q3B-O-B,q4B-O-B, q5A-O-A) for NiFe2O4 samples taken after 16, 18, 20 22, 52 minutes. Line connecting points guide to the eye.
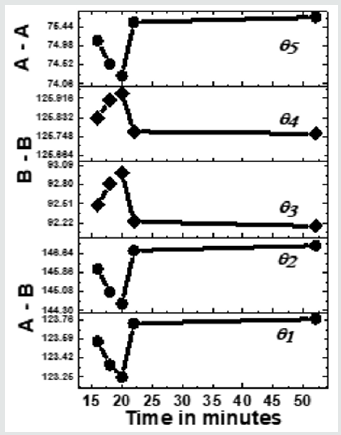
Figure 4 depicts hysteresis loops, reveal changes in Ms(exp.)samples taken after 16, 18, 20 22, 52 minutes, attributable to alteration of B-O-B, A-O-B, and A-O-A interaction, depends on bond angles, as shown in (Figure 3), and cationic distribution, as shown in (Table 1). (Figure 4) inset displays hysteresis loops of the samples taken after 8, 10, 12, 14 minutes, showing very low magnetization, attributable to the fact that in these samples ferrite phase is not formed, as was also observed in XRD data shown inset of (Figure 2) (a). Observed lower values of Ms(exp.) (ranging between 11.7 - 25.5 Am2/kg) as compared to the multi-domain bulk Ni ferrite (55 Am2/kg) is attributed to the two-component nanoparticle system as described in [19]consisting of a spin-disorder on the surface layer and ferrimagnetically aligned spins within the core. Computed magnetic dead layer thickness as described in [20,21]for NiFe2O4 samples taken after 16, 18, 20 22, 52 minutes are respectively 2.3, 1.8, 1.9, 2.5 and 3.6 nm. They confirm the contribution of 'dead layer thickness' in the reduction of Ms(exp.), apart from B-O-B, A-O-B, and A-O-A super-exchange interaction and cationic distribution.
Figure 4: Hysteresis loops of the studied NiFe2O4 samples taken after 16, 18, 20 22, 52 minutes. Inset: Hysteresis loops of the samples taken after 8, 10, 12, 14 minutes.
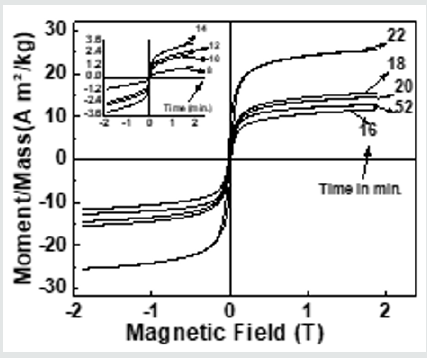
Table 1: Variation of experimental and theoretical lattice parameter (aexp., ath.), inversion parameter (), oxygen parameter (u), Cation distribution (for A, B site), and observed, calculated intensity ratios for I400/422, I220/400 plane for the studied samples.
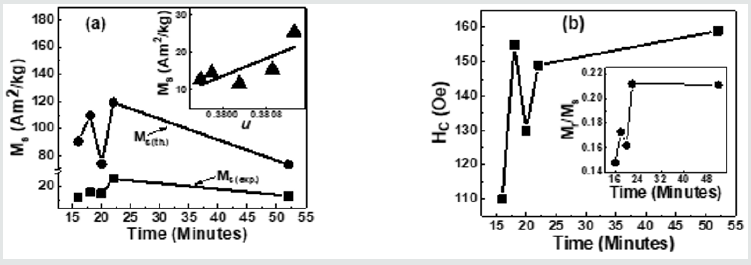
Figure 5(a) depicts Variation of Ms(exp.), Ms(th.)for NiFe2O4 samples taken after 16, 18, 20 22, 52 minutes. A perusal of figure 5(a) shows that observed behaviour is attributable to alteration of B-O-B, A-O-B, and A-O-A super-exchange interaction, depends on bond angles (see figure 3), and cationic distribution (see Table 1). Non-similar trend of Ms(exp.), Ms(th.)in (Figure 5)(a), shows that the magnetization behaviour is governed by Yafet-Kittel three sub-lattice model, described in [22], confirmed by the computed canting angle (aY-K) values for NiFe2O4 samples taken after 16, 18, 20 22, 52 minutes, which are respectively 52.7, 56.6, 46.2, 55.7, 46.9 ̊. The canting angle provides information on spin canting on the surface, is so-called 'magnetic dead layer,' leads to a reduction of Ms(exp.), which is lower than bulk saturation magnetization of Ni ferrite (55 Am2/kg). Inset of Figure 5 (a) shows the variation of Ms(exp.) with oxygen parameter 'u'(which is a measure of disorder in the samples [1]). Figure 5 (a) shows the disorder-induced enhancement of Ms(exp.),as was also reported in [3]. (Figure 5) (b) depicts the Coercivity(Hc) variation for NiFe2O4 samples taken after 16, 18, 20 22, 52 minutes. Obtained Hcand related Dvalues imply that studied samples lie in the region with overlap between single or multi-domain structures, as reported earlier [3]. (Figure 5) (b) Inset depicts the variation of Mr/Ms for NiFe2O4 samples taken after 16, 18, 20 22, 52 minutes. Mr/Ms values ranging between 0.15-0.22 reveal enhanced inter-grain interactions suggesting isotropic behavior of the material [23] reveal multi-domain particles with no preferential magnetization direction. Time-dependent tunable structural, magnetic properties during synthesis are valuable in achieving optimal properties of Ni ferrite for their usage in magnetic resonance imaging [5], hyperthermia [24] for cancer treatment, photocatalysis for water purification [11].
Figure 5: (a) Variation of Ms(exp.), Ms(th.)for NiFe2O4 samples taken after 16, 18, 20 22, 52 minutes. Inset: Dependence of Ms(exp.)on oxygen parameter (u), line connecting points in Inset are linear fit to the experimental data.; (b) Coercivity(Hc) variation for NiFe2O4 samples taken after 16, 18, 20 22, 52 minutes. Inset: Variation of Mr/Msfor NiFe2O4 samples taken after 16, 18, 20 22, 52 minutes.
Summary
To summarize, the sol-gel auto combustion technique is used to observe the time-development of structural, magnetic properties of Ni ferrite. Changes in cationic distribution lead to modification of structural properties, magnetic interactions, responsible for observed magnetic properties. Time-progression of properties are of use to alter structural, magnetic properties of Ni ferrite as a material for its prospective usage in heterogeneous catalysis, water purifications, biomedical applications.
Acknowledgments
Authors thank Dr. M. Gupta-L. Behra, UGC-DAE CSR, Indore for XRD measurements. Work supported by UGC-DAE CSR, Indore project (No.: CSR-IC-ISUM-25/CRS-308/2019-20/1360, dated March 5, 2020).
Conflicts of Interest
Author
Author Contributions
Conception: SNK; Sample synthesis, RV, SNK; Measurements, analysis of data: SNK, RV; Supervision, Resources, supervision, project management: SNK; Writing the manuscript: SNK, RV. All authors approve the draft and participate in reviewing.
For more Lupine
Publishers Open Access Journals Please visit our website:
wt u have given that
link add For more Modern Approaches
on Material Science articles Please Click Here:
https://lupinepublishers.com/material-science-journal/



No comments:
Post a Comment